

Analyse waves
After you select a location the app opens the Waves step. It automatically picks the most appropriate wave dataset for your point — typically a high-resolution regional hindcast where one is available, otherwise the global model. You can change it and tune how the statistics are discretised before running the analysis.
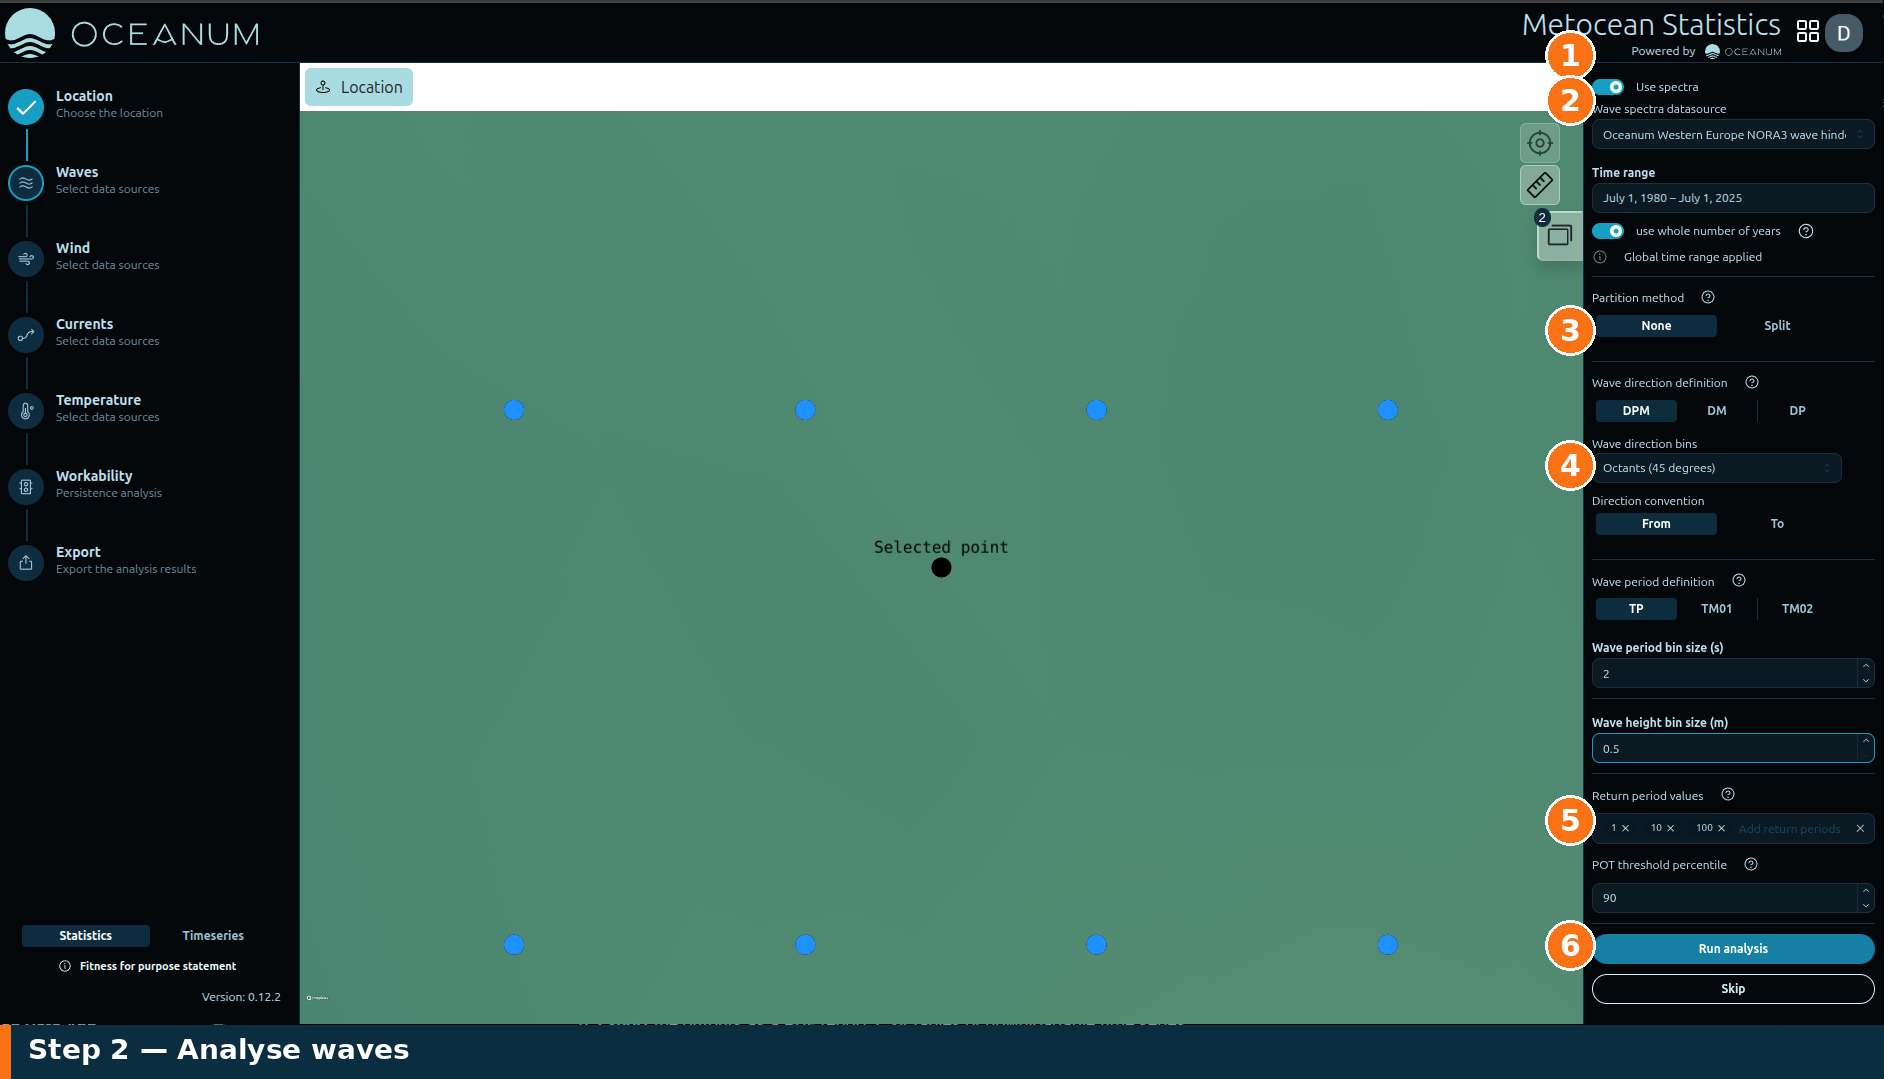
The Waves panel: 1 Use spectra, 2 wave dataset, 3 partition method, 4 wave direction bins, 5 return periods, 6 Run analysis. The partition and definition options (3) appear only when Use spectra is on.
1. Choose the wave dataset
Section titled “1. Choose the wave dataset”The Wave grid datasource dropdown lists the wave hindcasts that cover your location. Regional models (for example a 1 km coastal hindcast) give finer detail near the coast; the global model gives consistent worldwide coverage. The full catalogue is at datasets.oceanum.io.
Leave Use spectra on where the dataset includes full frequency–direction spectra — this unlocks sea/swell partitioning below.
2. Configure the statistics
Section titled “2. Configure the statistics”The remaining controls set how the wave climate is binned and summarised:
- Time range — inherited from the global time range, or set per variable. The panel shows the dataset’s own coverage.
- Wave direction bins — the number of directional sectors for roses and directional statistics (for example Octants, 45°).
- Direction convention — whether directions are reported as the direction waves come From or travel To.
- Wave period bin size (s) and Wave height bin size (m) — the resolution of the joint height/period distribution tables.
- Return period values (years) — the return periods to estimate for extremes (1, 10 and 100 years by default). Add or remove values as needed.
- POT threshold percentile — the percentile used as the peaks-over-threshold (POT) cut-off for the extreme value fit (90 by default).
3. Run the analysis
Section titled “3. Run the analysis”Click Run analysis. The app reads the time series from the Datamesh, computes the statistics and shows the results in the main panel (see Review the results). The Waves step gains a green tick and the app advances to Wind.
If you don’t need waves in this analysis, click Skip to move on without running them.
Sea/swell partitioning
Section titled “Sea/swell partitioning”When Use spectra is enabled, the app can partition the wave climate into wind-sea and swell components using the full spectra, separating locally generated seas from longer-period ocean swell. Where the dataset supports it you can also choose:
- the partition method — a simple period split or the spectral Watershed method;
- the wave direction definition — DPM, DM or DP;
- the peak period definition — Tp, Tm01 or Tm02.
Partitioning is available wherever spectral hindcast data are included in the selected dataset, and is most useful for interpreting wave climate at coastal and offshore sites.