

Review the results
When an analysis finishes, the results fill the main panel. Use the breadcrumb at the top (for example Location › Wave) to switch between variables, and the Statistics and Timeseries tabs at the bottom-left to switch between the two views.
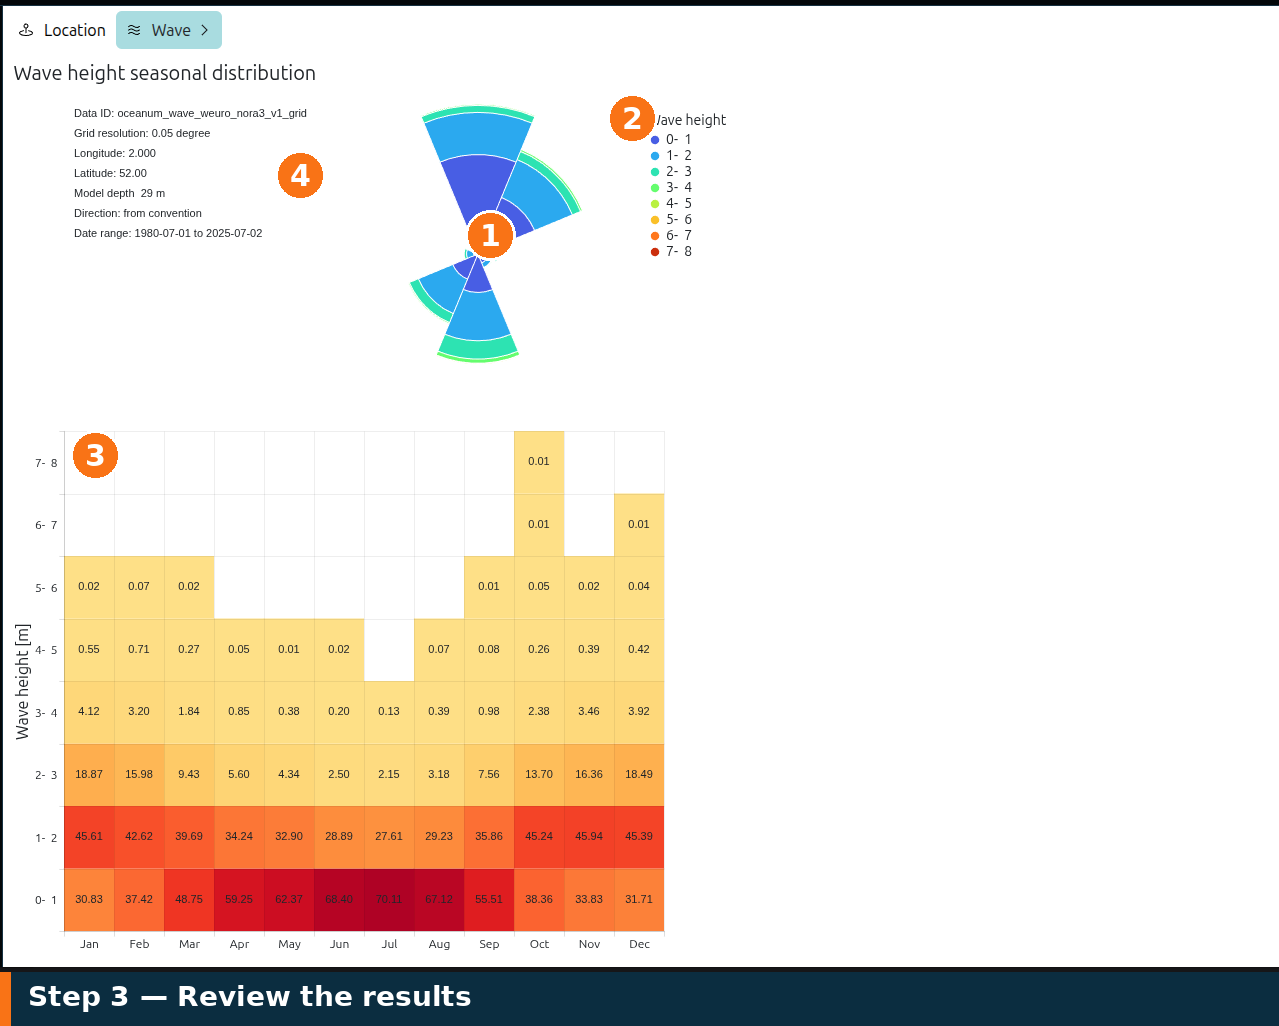
A results page (here the wave-height seasonal distribution): 1 directional rose, 2 wave-height colour scale, 3 seasonal heatmap, 4 dataset metadata.
Statistics view
Section titled “Statistics view”The Statistics view summarises the long-term climate for the selected variable. For waves, for example, it includes:
- Directional rose — the distribution of wave height by direction, with rings for the mean and the p10, p50, p90, p95 and p99 percentiles. Click a directional sector to filter every plot and table on the page to that sector; click again to clear the filter.
- Monthly statistics plot — percentile bands and the mean across the year, showing seasonality at a glance.
- Statistics tables — the underlying values (percentiles by month, directional distributions, non-exceedance and return-period extremes).
Each variable is summarised across a set of analysis pages — for waves these are the summary statistics, seasonal distribution, period distribution, directional distribution, non-exceedance and return-period extremes. These are also the pages you can include in an exported report.
A panel of metadata accompanies each result — the data ID, grid resolution, longitude and latitude, model depth, direction convention and the exact date range analysed — so every figure is traceable to its source.
Timeseries view
Section titled “Timeseries view”The Timeseries tab shows the raw time series the statistics are derived from, for the selected location and variables. Use it to inspect the data behind the summaries, check individual events, or sanity-check the period of record before exporting.
Re-running
Section titled “Re-running”To change anything — a different dataset, finer bins, extra return periods — reopen the relevant step in the sidebar, adjust the settings and run again. The results update in place. When you are happy with the analysis, continue to Workability or go straight to Export.