

Export the results
The Export step turns your analysis into report-ready outputs. Open it from the sidebar once you have run the variables you need.
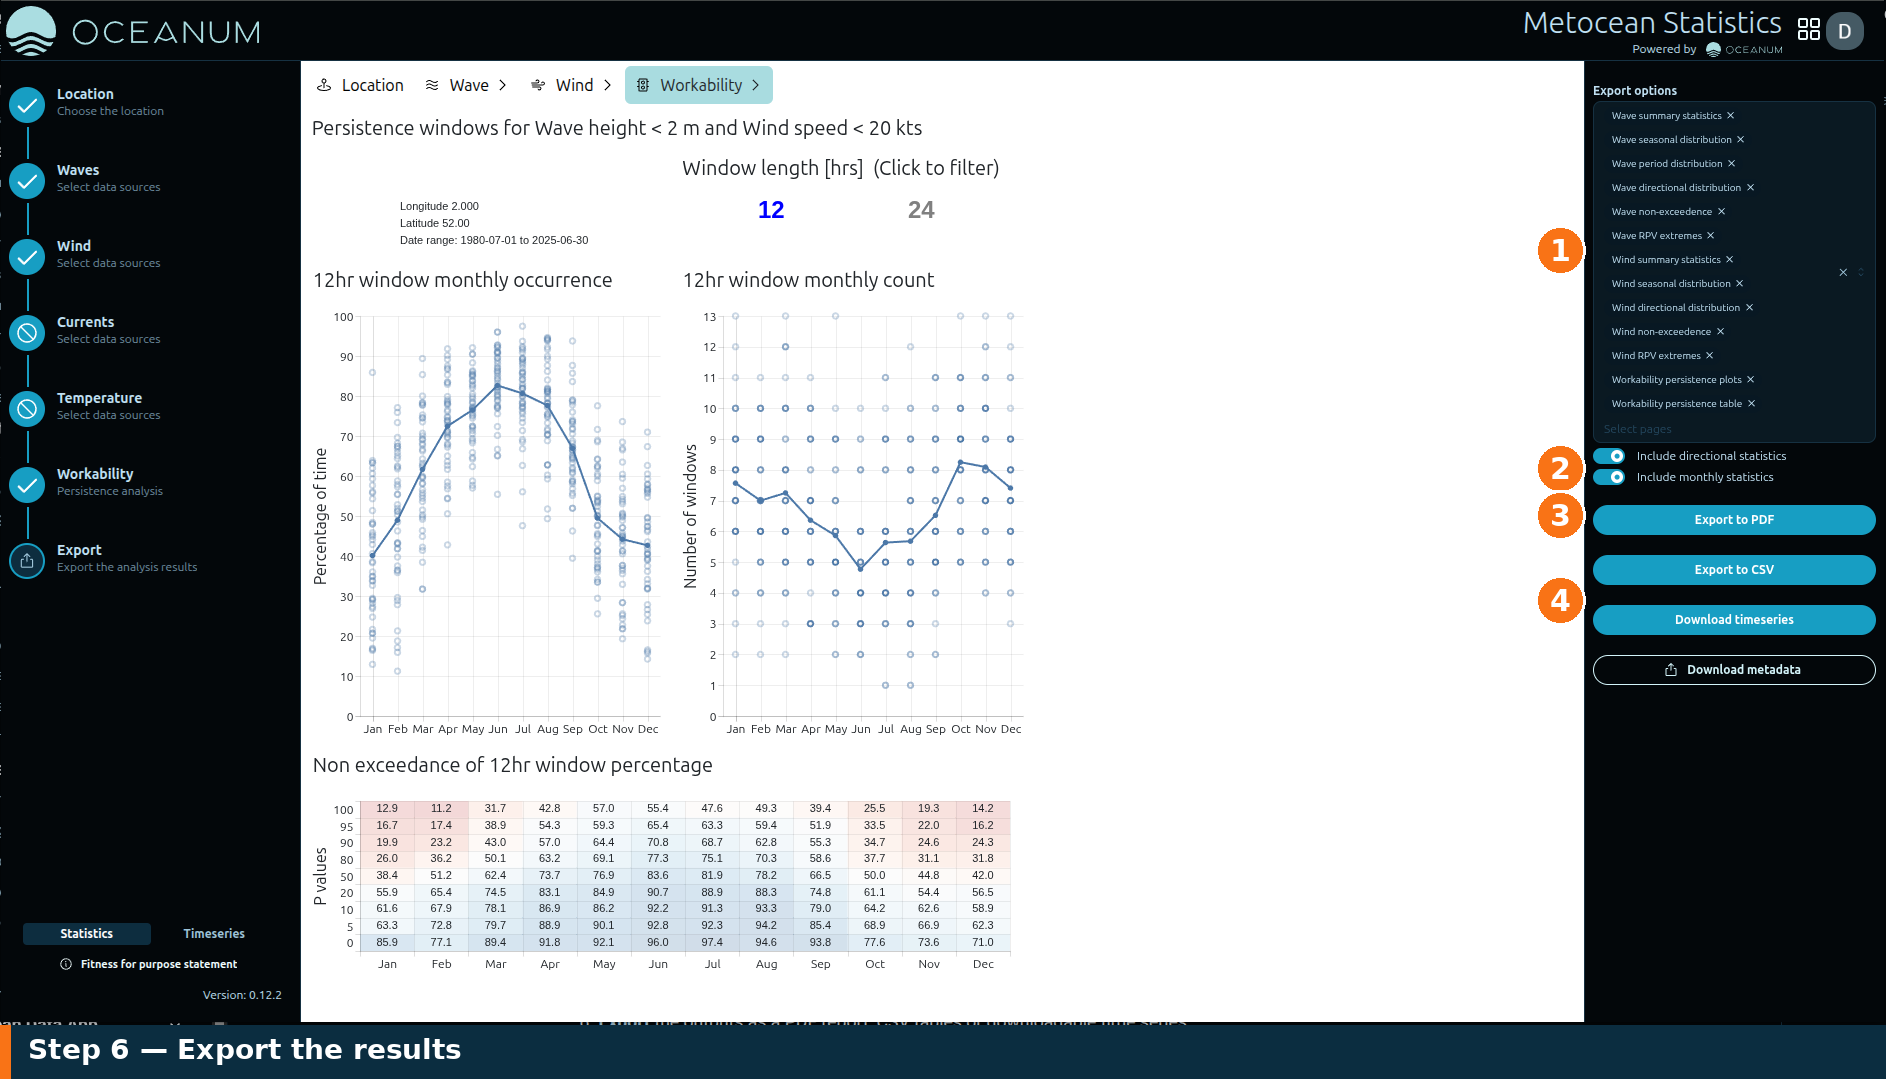
The Export panel: 1 choose which analysis pages to include, 2 toggle directional/monthly detail, 3 Export to PDF, 4 or export CSV tables, time series and metadata.
1. Choose what to include
Section titled “1. Choose what to include”Under Export options, select the analysis pages to include in the output. Each completed variable contributes its pages — for waves these are the summary statistics, seasonal distribution, period distribution, directional distribution, non-exceedance and return-period extremes. Remove any page with its ×, or add more from the Select pages list.
Two toggles control the level of detail:
- Include directional statistics — add the roses and per-sector tables.
- Include monthly statistics — add the month-by-month breakdowns.
2. Export
Section titled “2. Export”Choose the format that suits your next step:
- Export to PDF — a formatted report containing the selected plots and analysis pages, ready to share or attach to a deliverable.
- Export to CSV — the statistical results as tables (percentiles, directional distributions, non-exceedance and extremes) for use in your own tools.
- Download timeseries — the underlying time series for the selected location and variables, as CSV.
- Download metadata — a record of the datasets, location and settings used, so the analysis is fully reproducible.
Because the app pulls directly from the Datamesh, re-running the same configuration at a later date reproduces the same statistics — making it straightforward to keep deliverables consistent across a project or team.